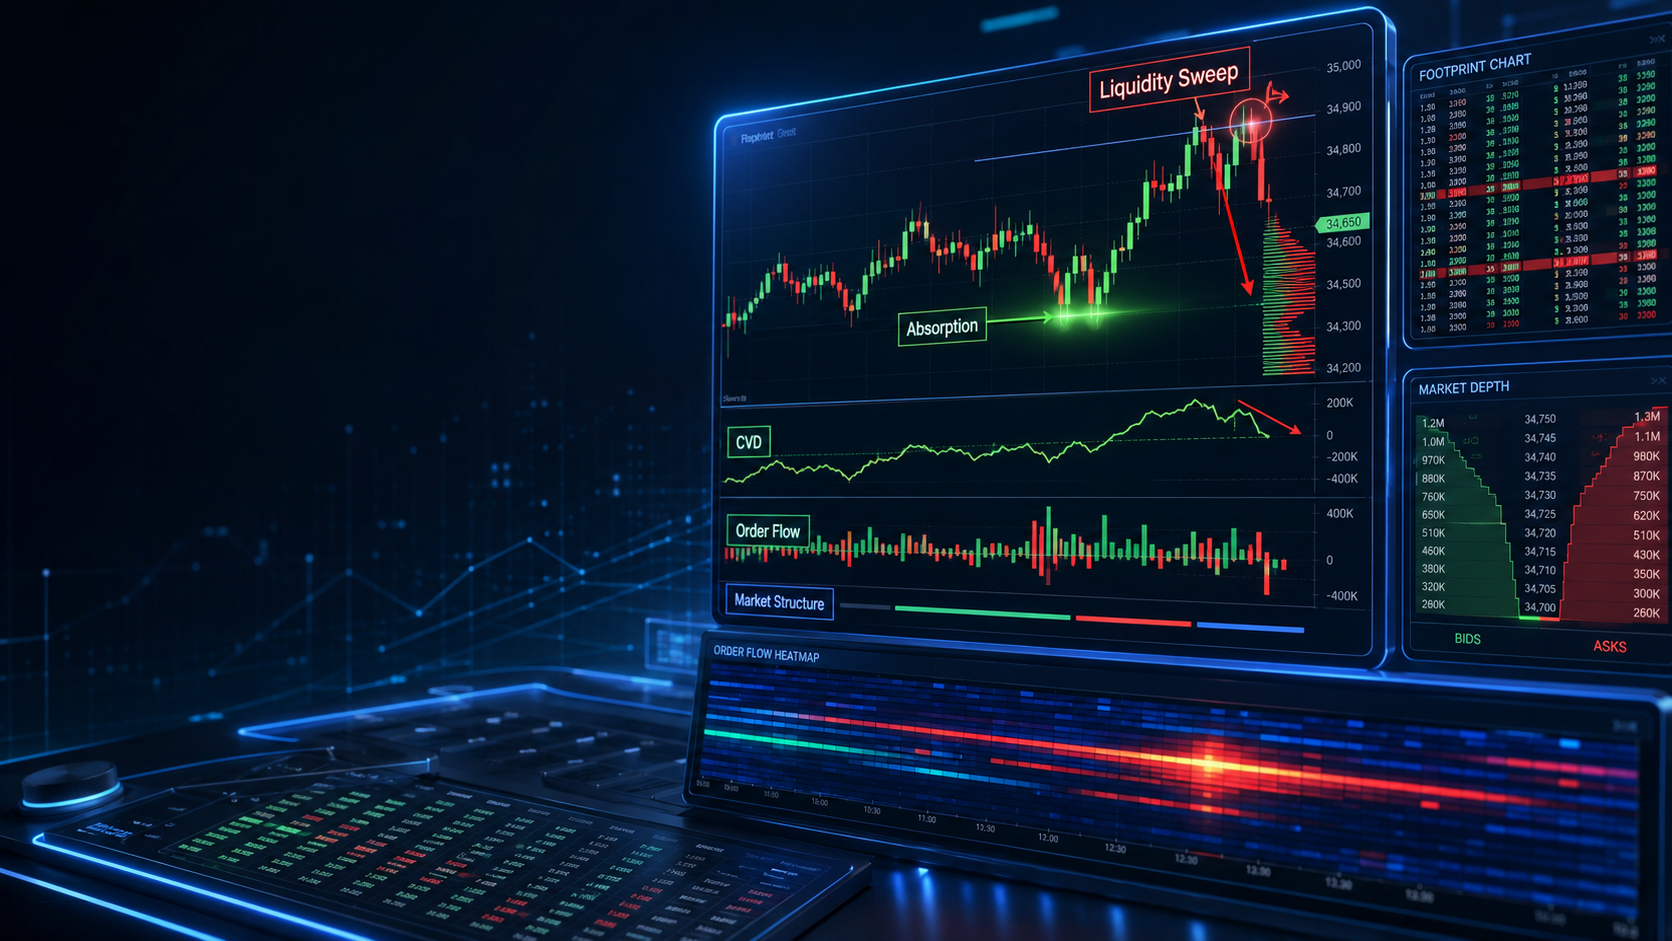
Financial markets are driven by the constant battle between buyers and sellers. While traditional price charts reveal where the market has moved, they often fail to explain why it moved. This is where Cumulative Volume Delta (CVD) becomes a valuable order flow tool.
Professional traders use CVD to uncover hidden buying and selling pressure, identify institutional activity, and detect market behaviors such as absorption and liquidity sweeps before significant price movements occur. When combined with price action and market structure, CVD offers a deeper understanding of market sentiment than price alone.
In this guide, you’ll learn what CVD is, how it works, how to interpret it correctly, and how to identify absorption and sweeps with practical examples.
What Is Cumulative Volume Delta (CVD)?
Cumulative Volume Delta (CVD) is an order flow indicator that measures the cumulative difference between aggressive buying volume and aggressive selling volume over time.
Instead of simply counting total trading volume, CVD tracks who is initiating trades:
- Aggressive buyers lift the ask price.
- Aggressive sellers hit the bid price.
The indicator continuously adds or subtracts this difference, creating a running total.
The basic concept is:
Volume Delta = Buy Market Orders − Sell Market Orders
CVD continuously accumulates these deltas throughout the trading session.
If buyers dominate:
- CVD rises.
- Buying pressure is increasing.
If sellers dominate:
- CVD falls.
- Selling pressure is increasing.
Unlike regular volume indicators, CVD reveals the balance of aggression between buyers and sellers.
Why CVD Matters
Many retail traders only watch candlestick patterns or support and resistance levels.
Institutional traders often look deeper by analyzing order flow because large participants leave footprints in the market.
CVD helps traders:
- Measure buying and selling pressure
- Confirm breakouts
- Detect false breakouts
- Spot institutional accumulation
- Identify distribution phases
- Find absorption zones
- Detect liquidity sweeps
- Validate trend strength
Understanding Market Orders vs Limit Orders
To understand CVD properly, it’s important to distinguish between two types of orders.
Market Orders
Market orders execute immediately.
Examples:
- Buy at current price
- Sell immediately
These aggressive orders move the market.
Limit Orders
Limit orders wait in the order book.
Large institutions often use huge limit orders to absorb aggressive buying or selling without moving price significantly.
Absorption occurs because of these resting limit orders.
What Is Absorption?
Absorption occurs when aggressive buying or selling is completely absorbed by larger passive orders.
In simple terms:
Many traders keep buying aggressively.
But price barely moves because a large seller keeps supplying liquidity.
Eventually, buyers become exhausted.
The market often reverses afterward.
Bullish Absorption
Imagine Bitcoin drops toward a major support level.
You notice:
- Heavy market selling
- Falling CVD
- Price refuses to make new lows
This suggests buyers are absorbing all selling pressure.
Once sellers run out:
- Price rallies.
- Buyers take control.
Bearish Absorption
Now imagine Bitcoin reaches resistance.
You observe:
- Heavy buying
- Rising CVD
- Price cannot move higher
Large institutions may be selling into all that buying.
Eventually:
- Buyers become trapped.
- Price falls sharply.
How to Spot Absorption Using CVD
Several clues usually appear together.
1. Strong CVD Movement
Aggressive buying or selling increases rapidly.
Example:
- CVD rises sharply.
But…
Price barely moves.
2. Price Stalls
Even though traders continue buying aggressively:
- Higher highs stop forming.
Or:
Despite aggressive selling:
- Lower lows fail to appear.
3. Large Volume
Absorption usually happens during high-volume trading.
Higher volume increases confidence that institutions are active.
4. Reversal Begins
Once aggressive traders become exhausted:
- Price reverses.
- CVD may continue briefly before changing direction.
This is often one of the strongest reversal signals in order flow trading.
What Is a Liquidity Sweep?
Financial markets naturally seek liquidity.
Large institutions require massive order sizes.
To fill these orders efficiently, they often push price into areas where stop-loss orders are clustered.
This temporary move is called a liquidity sweep.
After collecting liquidity:
- Price often reverses quickly.
Common Sweep Locations
Liquidity usually accumulates around:
- Previous highs
- Previous lows
- Equal highs
- Equal lows
- Daily highs
- Daily lows
- Session highs
- Session lows
These areas contain numerous stop-loss and breakout orders.
Using CVD to Identify Sweeps
CVD provides valuable confirmation that a sweep is genuine rather than the start of a new trend.Bullish Sweep
Suppose price breaks below yesterday’s low.
Retail traders panic.
Stop-loss orders trigger.
Aggressive selling floods the market.
CVD drops sharply.
However:
Price immediately recovers above the previous low.
This indicates:
Large buyers absorbed the selling.
The breakdown becomes a false breakout.
A bullish reversal often follows.
Bearish Sweep
Price pushes above resistance.
Breakout traders enter long positions.
CVD rises aggressively.
Suddenly:
Price falls back below resistance.
This indicates:
Large sellers used breakout buyers as liquidity.
The breakout fails.
Price declines afterward.
CVD Divergence
One of the most useful concepts is CVD divergence.
A divergence occurs when price and CVD disagree.
Bullish Divergence
Price:
- Makes lower lows.
CVD:
- Makes higher lows.
Interpretation:
Selling pressure is weakening.
Buyers are becoming stronger.
Bullish reversal probability increases.
Bearish Divergence
Price:
- Makes higher highs.
CVD:
- Makes lower highs.
Interpretation:
Buying pressure is fading.
Large sellers may be entering the market.
Bearish reversal becomes more likely.
Combining CVD with Other Trading Tools
CVD performs best when combined with additional forms of market analysis rather than being used in isolation.
Useful combinations include:
Market Structure
Use CVD to confirm:
- Higher highs
- Higher lows
- Breaks of structure
- Trend reversals
Support and Resistance
Absorption near strong support often signals buying.
Absorption near resistance often signals selling.
Volume Profile
Volume Profile identifies areas where institutions previously traded heavily.
CVD helps determine whether buyers or sellers currently dominate those areas.
Footprint Charts
Footprint charts display executed trades at each price level.
Together with CVD, they reveal:
- Aggressive order flow
- Absorption
- Trapped traders
- Exhaustion
Common Mistakes When Using CVD
Many beginners misuse CVD because they focus only on the indicator.
Avoid these mistakes:
Ignoring price action
Price remains the most important source of market information.
Trading every divergence
Not every divergence results in a reversal.
Always seek confirmation.
Ignoring higher timeframes
A bullish CVD signal on a 5-minute chart may conflict with a strong bearish daily trend.
Using CVD alone
Combine CVD with support, resistance, market structure, and volume analysis.
Practical Example
Imagine Ethereum is trading near a major resistance level.
You observe:
- Price breaks above resistance.
- CVD rises aggressively.
- Buying volume increases dramatically.
However:
- Price cannot continue higher.
- Large upper wicks appear.
- CVD continues rising while price stalls.
This suggests sellers are absorbing aggressive buying.
Minutes later:
- Price falls below resistance.
- Breakout traders become trapped.
- Selling accelerates.
This is a classic example of bearish absorption followed by a liquidity sweep.
Traders who recognized the CVD signal early had additional evidence that the breakout lacked genuine institutional support.
Best Practices for Reading CVD
To improve your analysis:
- Focus on the relationship between CVD and price rather than the indicator alone.
- Watch for absorption near key support and resistance levels.
- Use CVD to confirm or reject breakouts.
- Monitor divergences for early signs of weakening momentum.
- Combine CVD with Volume Profile, Footprint Charts, and market structure.
- Practice on historical charts before applying CVD in live trading.
Consistency and context are far more valuable than reacting to every change in the indicator.
Frequently Asked Questions (FAQ)
Is CVD suitable for beginners?
Yes, but it has a learning curve. Beginners should first understand market orders, limit orders, and basic price action before relying on CVD.
Does CVD predict market direction?
No. CVD does not predict the future. It measures buying and selling aggression, helping traders interpret the strength or weakness behind price movements.
Can CVD be used in all markets?
CVD is commonly used in futures and cryptocurrency markets where reliable order flow data is available. Its effectiveness in spot forex depends on the quality of the volume data provided by the trading platform.
What is the difference between volume and CVD?
Standard volume measures the total number of contracts or shares traded, while CVD measures the net difference between aggressive buying and aggressive selling, providing deeper insight into market participation.
Conclusion
Cumulative Volume Delta (CVD) is one of the most powerful tools in modern order flow analysis because it reveals the underlying battle between buyers and sellers that price charts alone cannot show. By learning to interpret CVD alongside price action, traders can better identify absorption, recognize liquidity sweeps, confirm breakouts, and spot potential reversals before they become obvious.
However, no indicator is infallible. The most effective approach is to use CVD as part of a broader trading framework that includes market structure, support and resistance, and volume analysis. With consistent practice and disciplined risk management, CVD can become a valuable component of an informed trading strategy, helping traders make more confident decisions in fast-moving markets.